
Granular Physics Research
We are fascinated by granular physics! There is much to learn about how microscale features organize to create emergent meso- and macroscale properties that geophysicist typically measure and use (e.g., force chains and seismic velocities). With developments in discrete element models, high-performance computing, and synchrotron-based x-ray microtomography, alongside the popularization of the use of statistical physics tools to study the soft part of the Earth, we believe that granular media physics studies will continue to be an exciting area of research for decades to come. Browse some of our research below!
The Effects of 180 Years of Aging on the Physical and Seismic Properties of Sands
[Lead Author: Vashan Wright]
Constraining how both the physical properties and seismic responses of recently deposits sands change with time is important for understanding earthquake site response, subsurface fluid flow, and the early stages of sandstone lithification. Currently, however, there is no detailed (cm-scale) assessment of how sand physical properties and associated seismic velocities evolve over the first 1-2 centuries sand deposition. This study integrates sand-sedimentation rate estimates with seismic velocity and physical properties data to determine how the physical properties of vadose zone sands (upper 1.8-2.2 m) change within 180 years after deposition.
The analyses at four sites along Port Royal beach Jamaica (Fig.1) show that compressional and shear wave velocities increase with sediment age whereas porosity, grain size, sorting, mineralogy and cementation fraction remain relatively unchanged during the same period. Though rock physics models (constrained by measured physical properties) predict constant seismic velocities, we observe larger misfits between modeled and observed velocities with sediment age. To explain the difference between models and observations, this study proposes that shallow sands undergo microstructural matrix changes (e.g., grain rolling, rotation, and slippage) that lead to a more uniform distribution of grain contact forces and a resulting increase in seismic velocities with time. The results imply that natural siliciclastic beach sands undergo a previously undocumented lithification process (similar to aging via contact creep) that occurs before compaction.
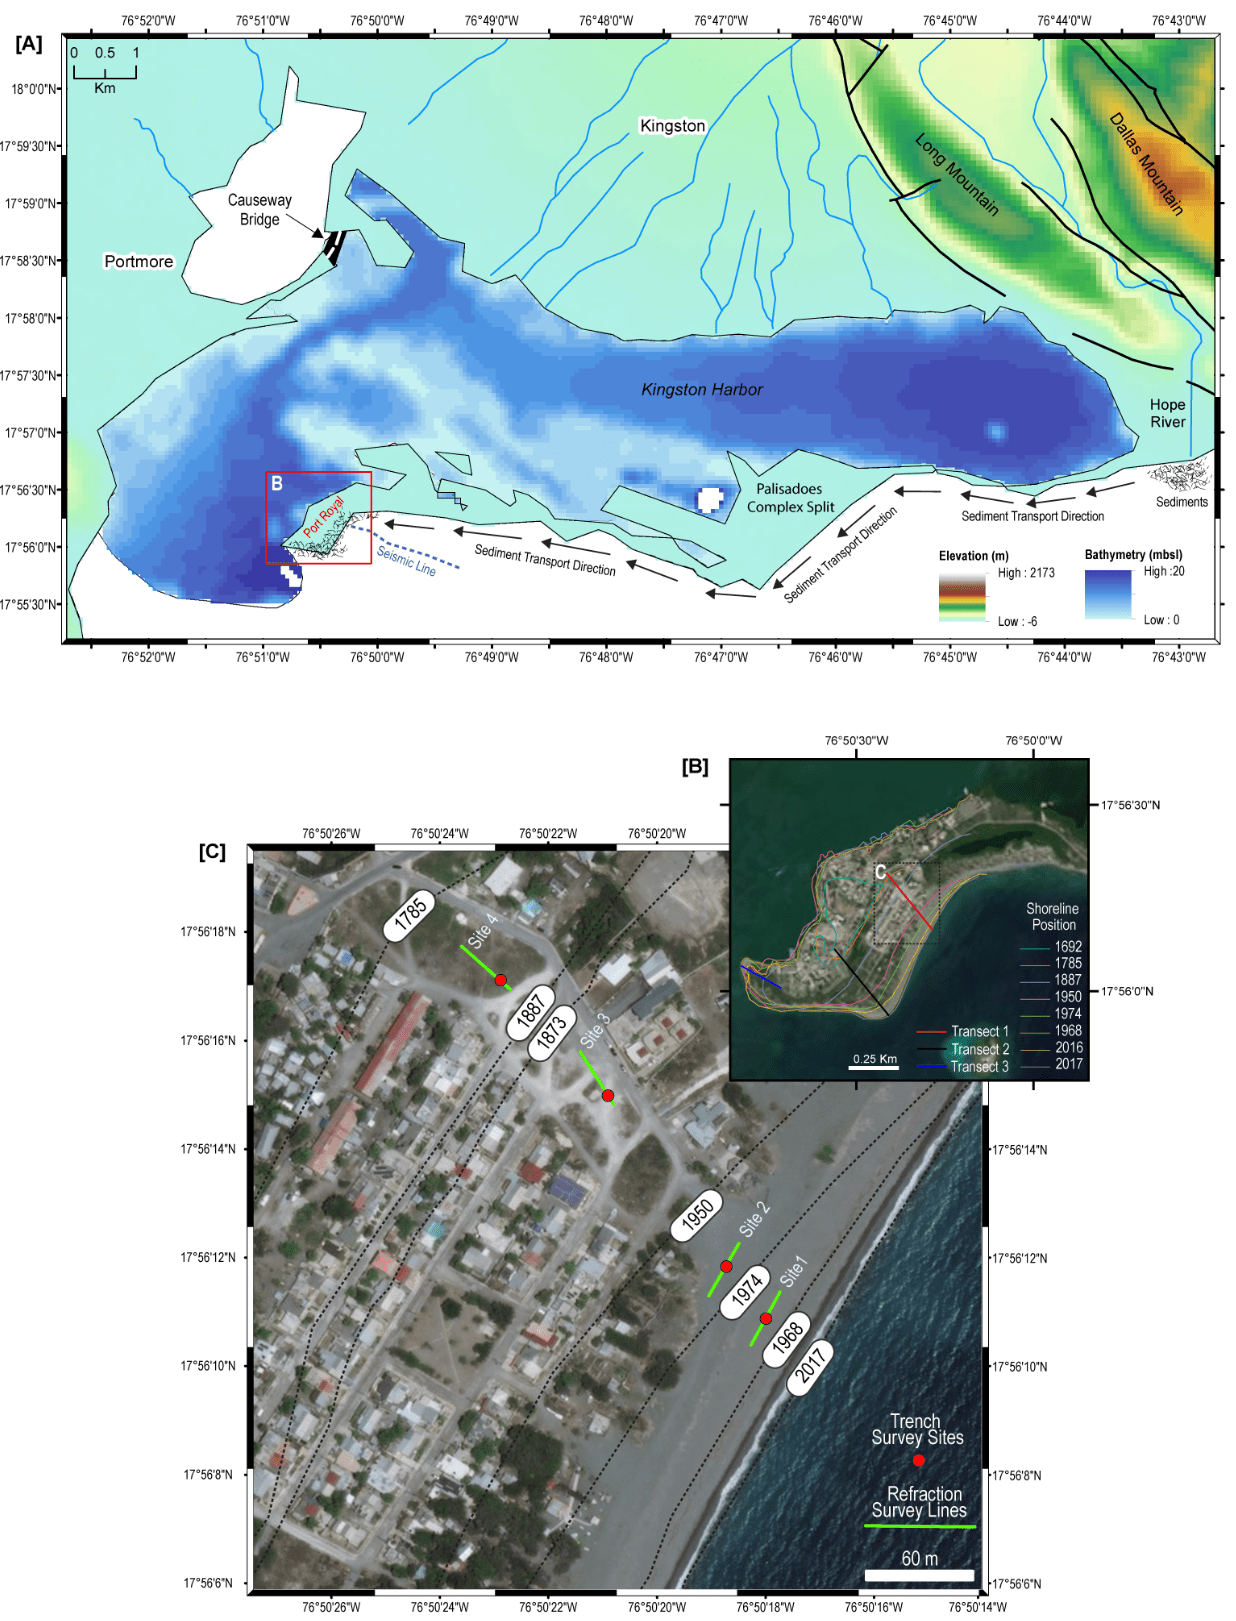
Figure 1. (A) Topographic map of Kingston Jamaica with locations for Port Royal and the Palisadoes Complex Spit identified. Blue dashed line is a seismic-reflection profile (Wright et al., 2019, Tectonics) used to determine slope. (B) Aerial Imagery map of Port Royal Jamaica showing shoreline positions and transects where we estimate sediment progradation rates, which were highest between sites 2-3 and lowest between sites 1 and 4. Site 1-4’s sediments were deposited between 1988-2016, 1956-1974, 1909-1923, and 1837-1862, respectively.
On the use of rock physics models for studying the critical zone
[Lead Author: Vashan Wright]
How effective are rock physics models for relating seismic velocities to the physical properties of sediments, fluids, and cement within the critical zone, and what factors most substantially influence the models’ accuracies? We answer these questions by testing and analyzing the accuracies of seven rock physics models (Hertz-Mindlin, Walton, Jenkins, Digby, stiff sand, soft sand, and contact cement) for estimating seismic velocities of vadose zone sands at Port Royal Beach in Jamaica. These sands are clean, well-rounded, and highly-spherical, which are ideal for rock physics model testing. Measured velocities and model input parameters (e.g., porosity, density, grain size, and fluid saturation percentage) derive from seismic refraction surveys and sidewall sediment cores, respectively. We find that, in their current forms, all seven rock physics models overpredict seismic velocities for sands deposited within the last forty-three years. Misfits between measured and predicted velocities reduce with time since deposition, with all but one (Digby) cementless models accurately predicting the seismic velocities for sands older than ninety-five years. Jenkins, followed by Walton, Hertz-Mindlin, and soft sand models are generally most accurate (i.e., have the lowest misfits), possibly because high porosity sands like the ones at Port Royal Beach are more susceptible to tangential slip during seismic wave propagation. The models will most substantially improve when the effects of the existence and locations of strong versus weak force-chain links are included in their respective equations.
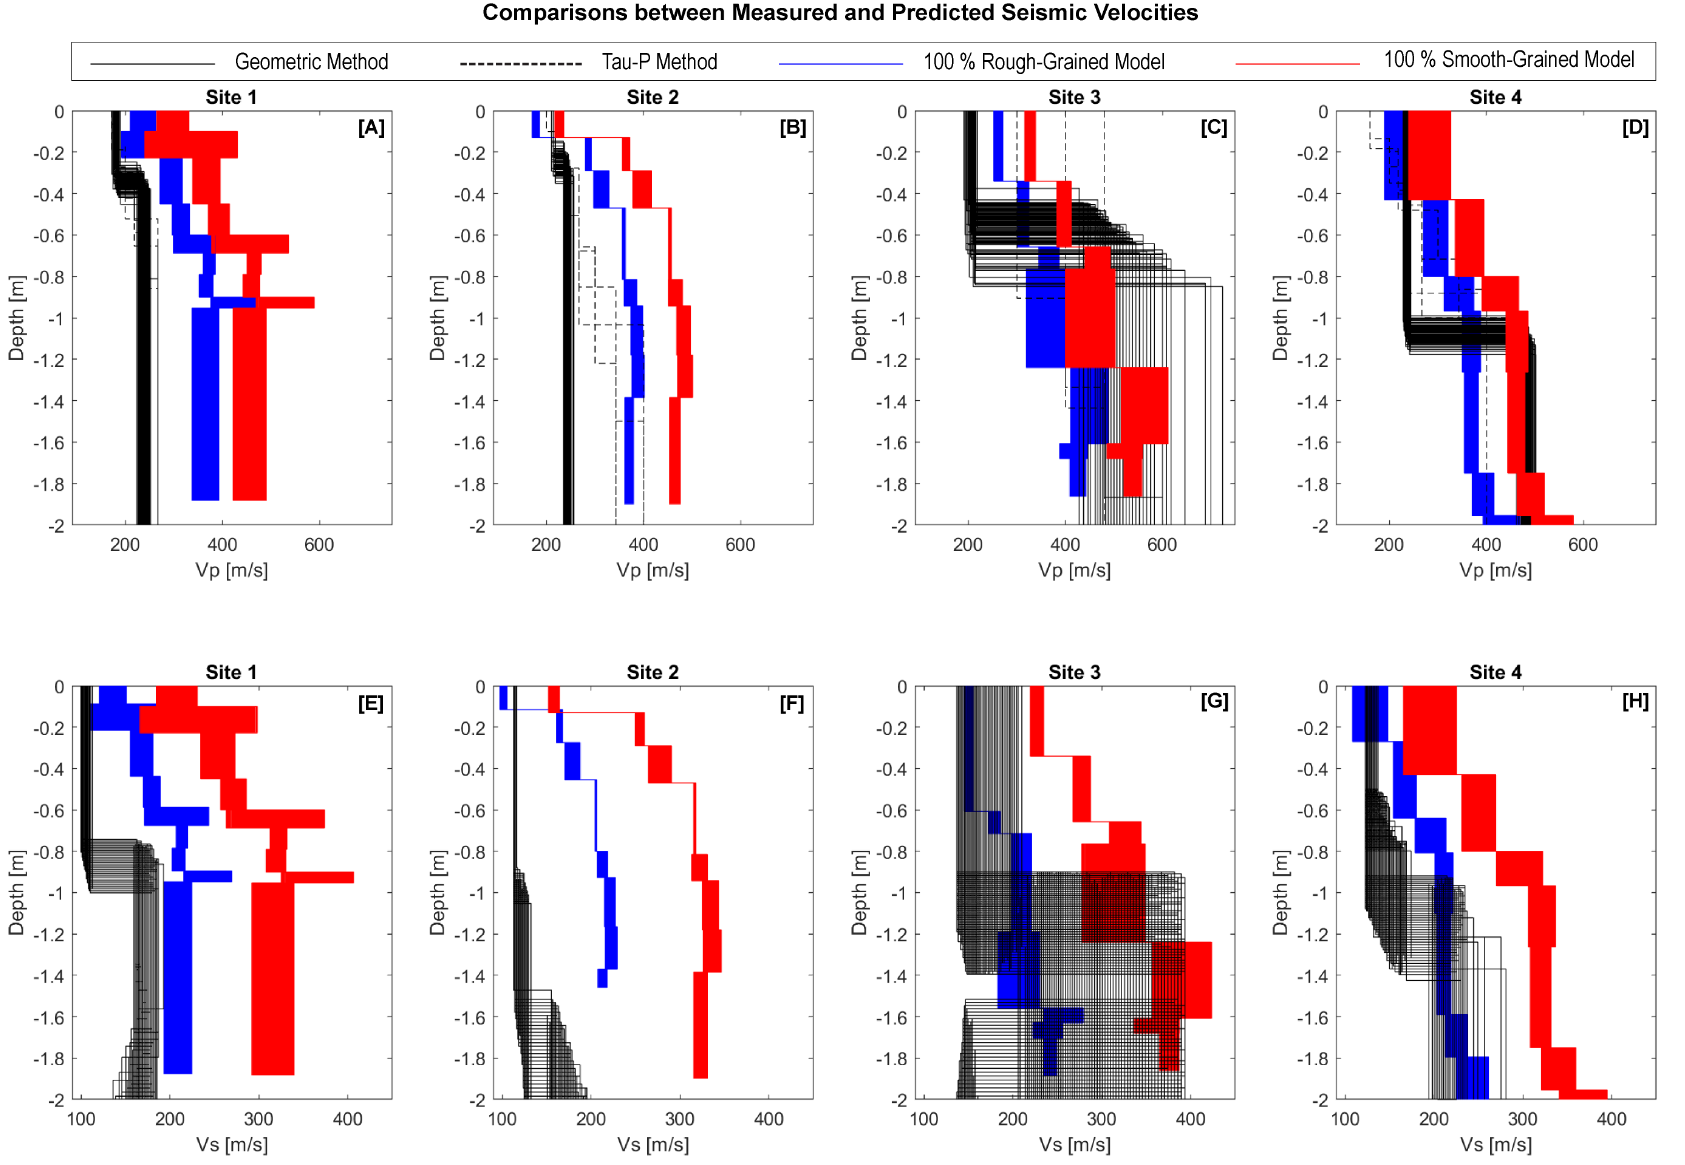
Figure 1. Comparisons between the Hertz-Mindlin (1949) rock physics modeled and measured seismic velocities at four sites at Port Royal Beach in Jamaica.
Coordination Numbers of Beach Sands
[Lead Author: Vashan Wright]
Coordination number controls elastic moduli, seismic velocity, and force transmission in sands and is thus a critical factor controlling the resistance of sands to deformation. Previous studies quantified relationships between coordination number, porosity, grain size, sphericity, and effective stress in pluviated or modeled sands. Here, we determine if these relationships hold in naturally-deposited beach sands. We collect samples while preserving their microstructures and use x-ray computed microtomography images to characterize grain properties. Similar to pluviated and modeled sand studies, we find that average coordination numbers and porosities for freshly deposited natural sands are 8.1 ± 2.8 and 0.37 ± 0.01, respectively. The range and standard deviation in coordination numbers of the natural beach sands are, however, significantly higher than observed in pluviated and modeled sand studies. At the same effective stress and porosities, coordination number is linearly proportional with grain surface area except for the smallest and largest grains. Coordination number depends non-linearly on sphericity. We attribute the higher ranges and standard deviations of coordination numbers in the natural sands to its broader grain size distribution, and we propose that the largest grains limit grain rearrangement, which influences spatial distributions of coordination numbers in natural sands.
Figure 2. (a) Relationships between coordination number and porosity for natural sand at Alameda County beach, Berkeley, California. (b) Comparison between coordination number in pluviated, modeled, and naturally-deposited sands. The gray shading is the standard deviation for the dataset produced by the Smith (1929) dataset. The image is modified from Mavko et al., (2020, the Rock Physics Handbook).
Microstructural differences between naturally-deposited and laboratory beach sands
[Lead Author: Amy Ferrick] [Second Author: Vashan Wright]
The orientation of, and contacts between, grains of sand reflect the processes that deposit the sands. Grain orientation and contact geometry also influence mechanical properties. Quantifying and understanding sand microstructure thus provide an opportunity to understand depositional processes better and connect microstructure and macroscopic properties. Using x-ray computed microtomography, we compare the microstructure of naturally-deposited beach sands and laboratory sands created by air pluviation in which samples are formed by raining sand grains into a container. We find that naturally-deposited sands have a narrower distribution of coordination number (i.e., the number of grains in contact) and a broader distribution of grain orientations than pluviated sands. The naturally-deposited sand grains orient inclined to the horizontal, and the pluviated sand grains orient horizontally. We explain the microstructural differences between the two different depositional methods by flowing water at beaches that re-positions and reorients grains initially deposited in unstable grain configurations.
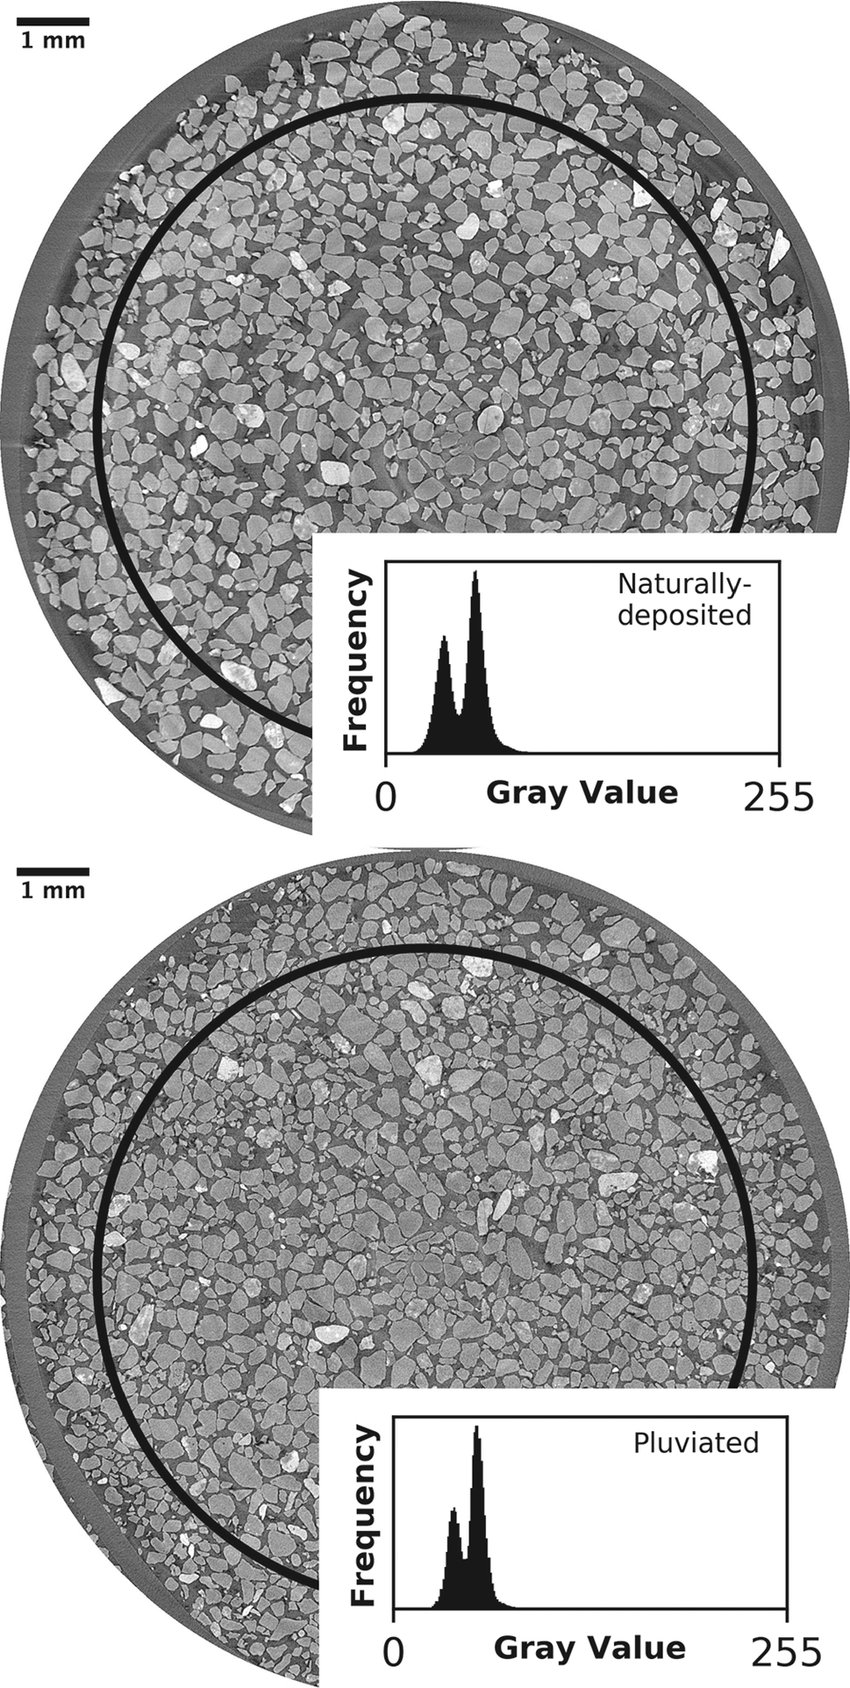
Figure 1. X-ray computed microtomography images showing horizontal cross-sections of the naturally-deposited (top) and pluviated (bottom) sands. The black circles denote the 9 mm diameter of the image subsection we consider in our analyses.
Sediment failure via density of modes
[Lead Author: Richard Kilburn]
The ground beneath our feet shifts over time, sometimes slowly creeping, sometimes flowing like a fluid, and sometimes suddenly failing. Sudden shifts in the shallowest parts of the ground produce geohazards (e.g., landslides, ground fissures, and liquefaction) that often cause loss of life and destroy infrastructure. The frequency and destructive capabilities of these geohazards have increased as global warming worsens, sea levels rise, and extreme weather events intensify. Compounding this, rapid population growth and social injustice have pushed human development into sections of the Earth that now shift and destabilize in more catastrophic ways. The impacts of these shifts disproportionately affect Black, Brown, Indigenous, and impoverished communities. Yet, current state-of-the-art methods can not forecast these events, largely because we lack reliable ways to incorporate grain and mesoscale information into failure models.
This ongoing work uses x-ray microtomography, lab experiments, and machine learning to quantify how grain-scale properties influence sediments' density of excited vibration modes (DoM). This quantity measures the availability of low-frequency modes, which increases for amorphous solids as they lose rigidity. We aim to correlate changes in grain-scale structures and the shape of DoM for sediment exposed to small load steps. This work is critical to assessing if and how grain-scale processes provide insights into impending failure.
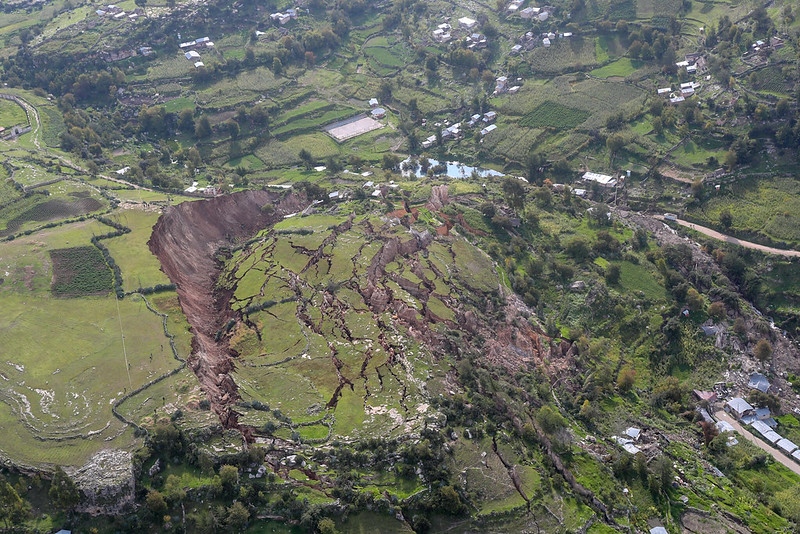
Figure 1. Image of a landslide near Cusco, Peru. [Source: https://www.flickr.com/photos/ministeriodedefensaperu/39935939755/in/dateposted/]; [Author: Galeria del Ministerio de Defensa del Perú].
Earthquake Effects on Sediments
[Lead Author: Vashan Wright]
The aim of this project is to provide the first 3-dimensional assessment of the effects of earthquakes on the microstructural properties (e.g., grain contact number and area, grain orientation and, pore shape) of unconsolidated sediments. I am doing this based on the analysis of x-ray microtomography images taken before and after exposing sediments to lab simulated earthquakes. Quantifying these properties changes are important for understanding earthquake site response (including repeat liquefaction) and earthquakes induced changes to groundwater flow and storage. This work will also assess the consequences of earthquake-induced changes to sands. An example of the initial results of this study is shown in figure 1 below.

Figure 1. A-B are microtomographic images taken before and after exposing sands to lab simulated earthquakes. C-D shows 3-d rose diagrams of bulk grain orientation. SVD – star volume distribution.
[Not] all seismic velocities are created equally
[Lead Author: Vashan Wright]
Are all seismic velocities created equally? That is, do sediments and rocks with the same seismic velocities respond the same to the same applied stresses? Some, if not most, geophysicists would likely say NO. Yet, we often treat all seismic velocities as being the same. Why? Because it simplifies the problem, with an averaging approximation that is useful. For example, when we assume that sediments with the same seismic velocities respond similarly to the same applied stress (e.g., earthquake waves), we sometimes can accurately forecast which sections of the crust are more prone to earthquake-triggered geohazards (e.g., landslide and liquefaction) than others. However, from a theoretical perspective, we have known that the assertion that all seismic velocities are created equally may be incomplete, especially for the unconsolidated part of the Earth filled with sediments. Thus, an interesting question is when does it matter that not all seismic velocities may not be created equally? When do our averaging (or continuum) approximations begin to limit our abilities to study rocks and sediments' roles in some of our most important problems, earthquake nucleation, landslides, submarine slide-induced tsunamis, and liquefaction events? This study uses lab experiments and theoretical rationales to study this problem in sediments.
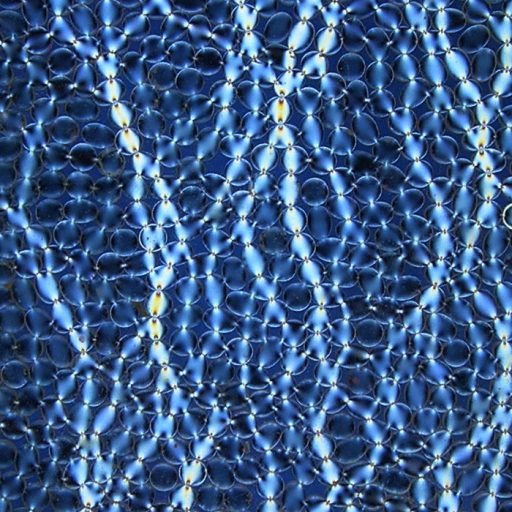
Figure 1. Image of force chains in photoelastic granular media, showing that microrheology of granular systems are heterogenous at the mesoscale. [Author: Karen Daniels].
A Minimally Cemented Shallow Crust Beneath InSight
[Lead Author: Vashan Wright]
Ice and other mineral cements in Mars' shallow subsurface affect the mechanical properties of the shallow crust, the geologic processes that shape the planet's surface, and the search for past or extant Martian life. Cements increase seismic velocities. We use rock physics models to infer cement properties from seismic velocities. Model results confirm that the upper 300 m of Mars beneath InSight is most likely composed of sediments and fractured basalts. Grains within sediment layers are unlikely to be cemented by ice or other mineral cements. Hence, any existing cements are nodular or formed away from grain contacts. Fractures within the basalt layers could be filled with gas, 2% mineral cement and 98% gas, and no more than 20% ice. Thus, no ice- or liquid water-saturated layers likely exist within the upper 300 m beneath InSight. Any past cement at grain contacts has likely been broken by impacts or marsquakes.
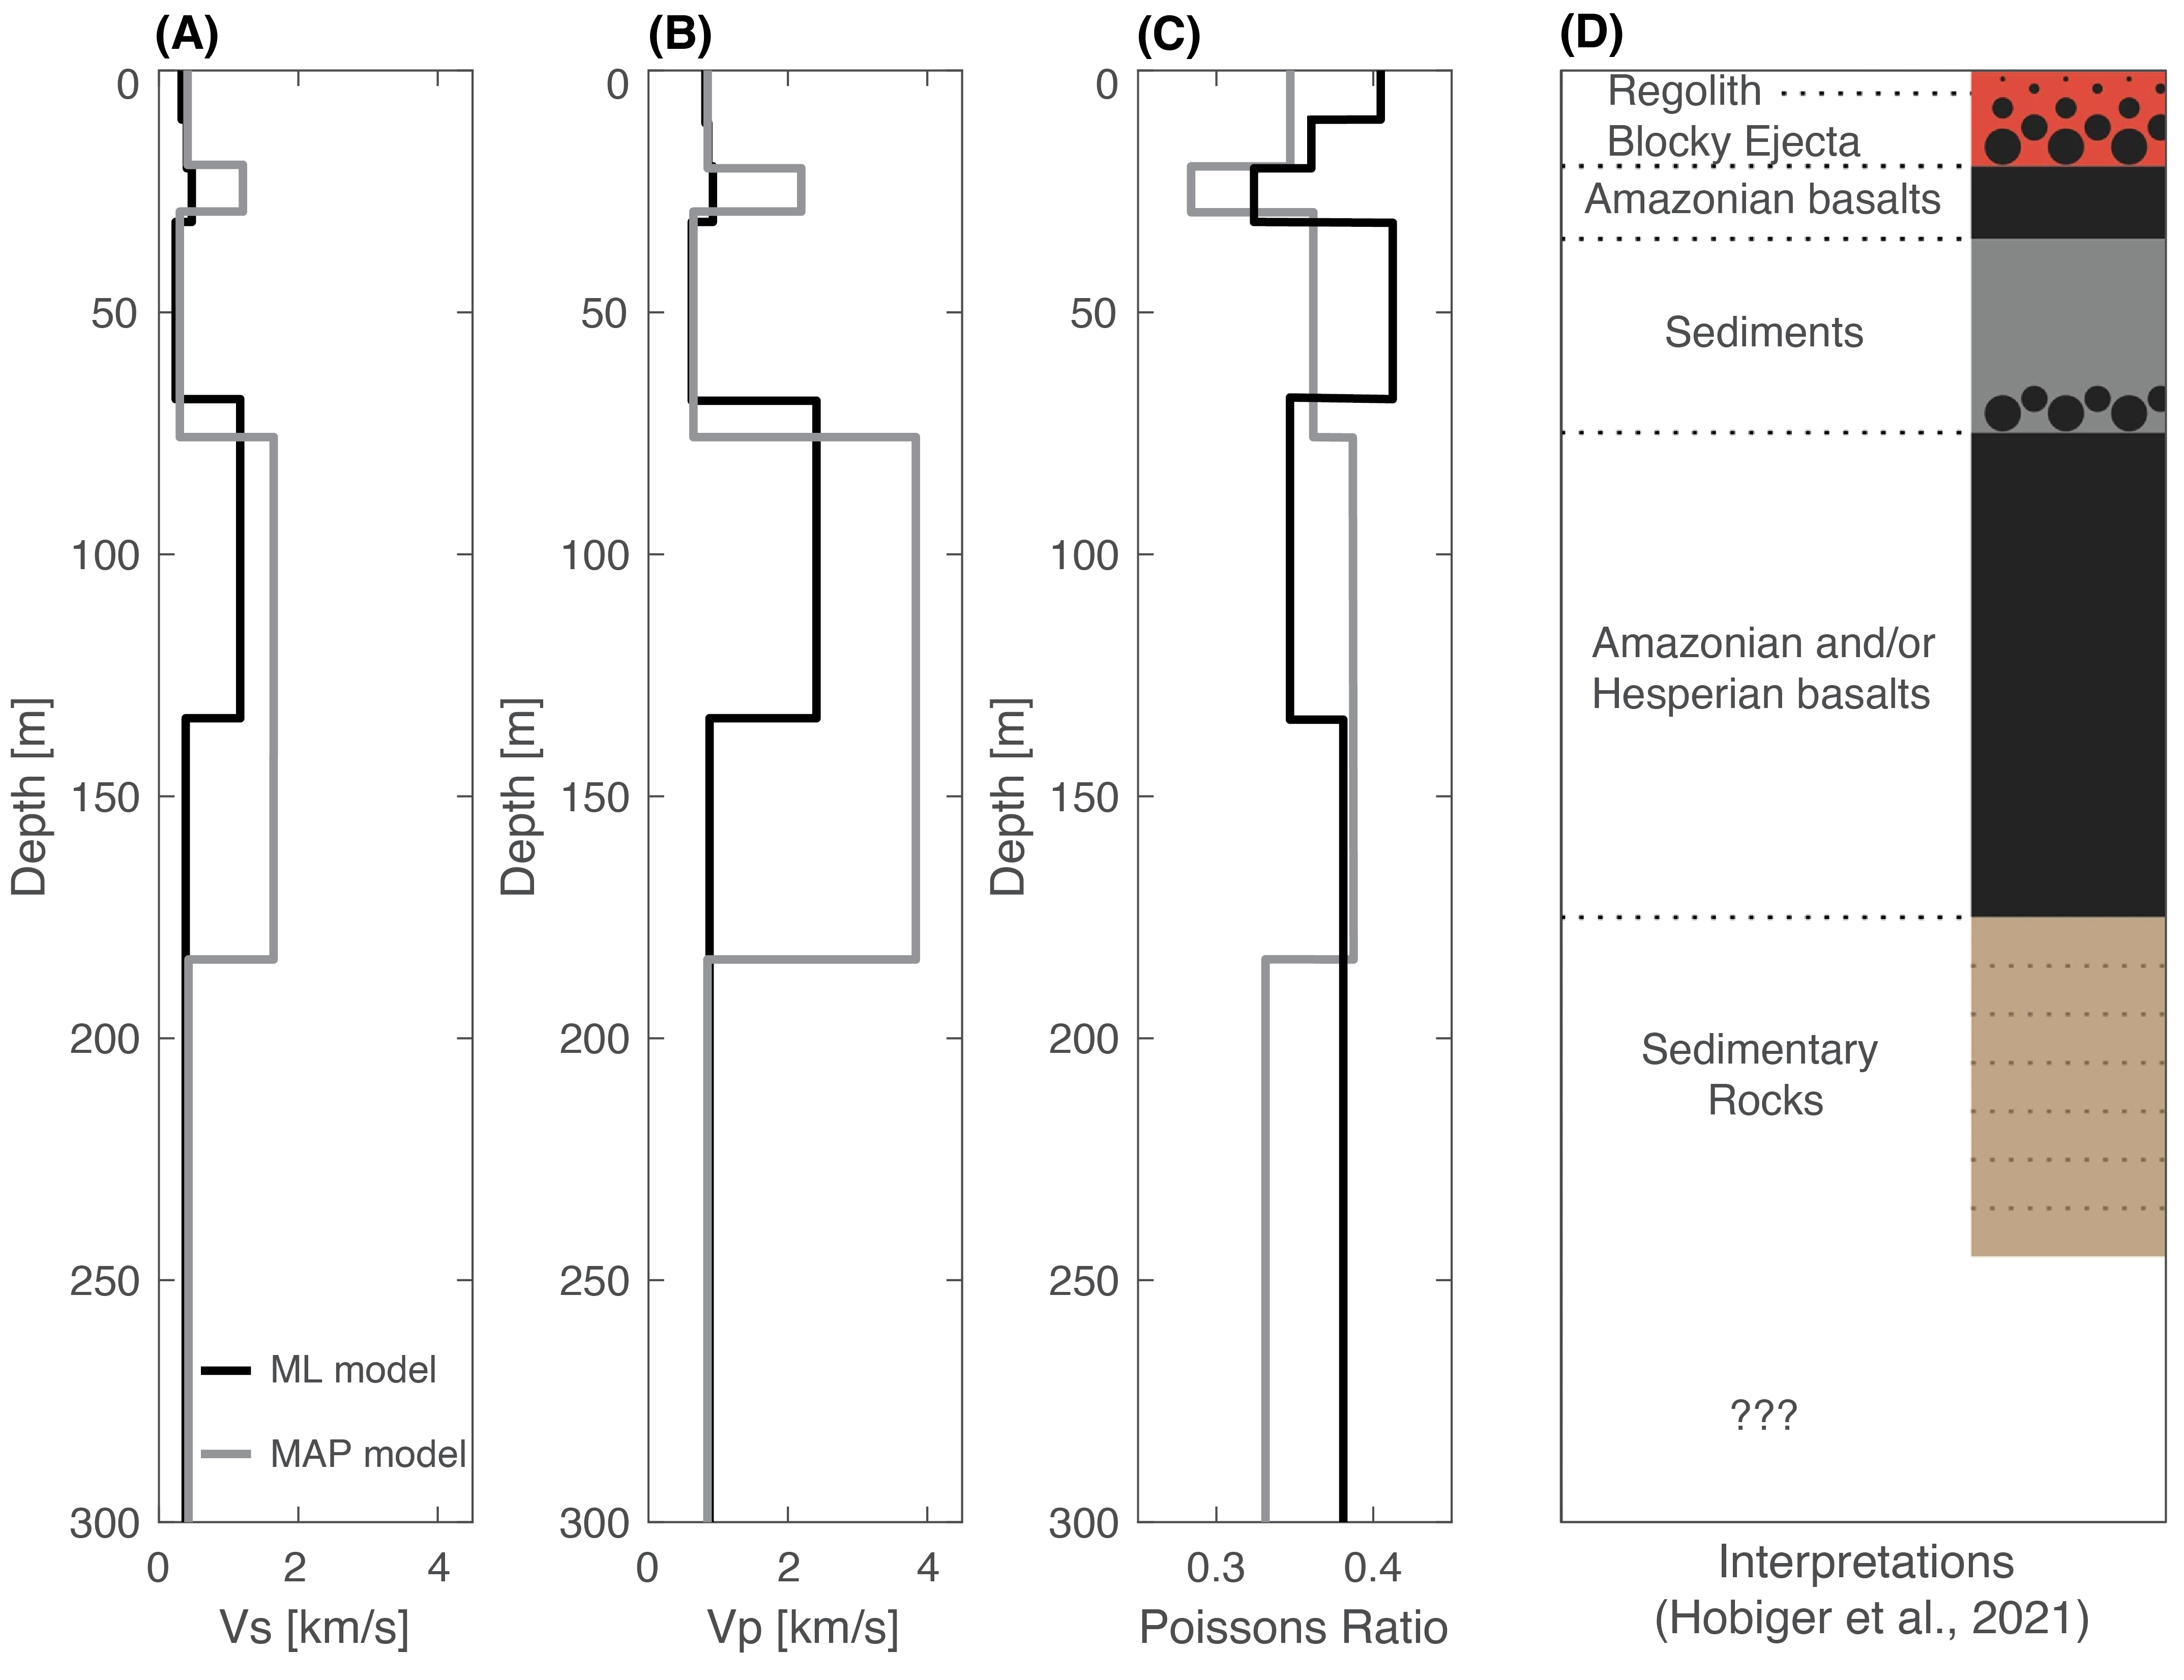
Figure 1. Models of (A) Vs and (B) Vp from Hobiger et al., (2021) and (C) calculated Poisson's ratio based on the seismic velocities. The black and grey curves are Hobiger et al., (2021)'s maximum likelihood (ML) and maximum a posteriori (MAP) models, respectively. (D) Inferred stratigraphy of the upper 300 m beneath InSight, from Hobiger et al., (2021), whose doi is https://doi.org/10.1038/s41467-021-26957-7.
Martian hydrogeology inferred from shear wave velocities
[Lead Author: Richard Kilburn]
We quantify the volume and distribution of water, cement, sediments, and fractured rocks within the Martian crust beneath NASA's InSight (Interior Exploration using Seismic Investigations, Geodesy, and Heat Transport mission) lander by using rock physics models to interpret shear wave velocities Vs measured from InSight data. The models assume that Mars' crust comprises sediments and fractured rocks whose pores and fractures host variable combinations of gas, liquid water, and mineral cements. Measured Vs in the upper crust (0-8 km) can be explained by layers of minimally (<2%) cemented sediments and gas-filled fractured basalts. Measured Vs in the deeper crust (8-20 km) can be explained by fractured basalts or more felsic igneous rocks (modeled here as 100% plagioclase feldspar) that is unfractured or has up to 23% porosity. Open pores in the deeper crust could host gas, liquid water, and up to 2% cement. Modeled Vs are too low for a seismically detectable ice-saturated cryosphere in the upper crust and temperatures are too high to freeze liquid water in the deeper crust. Notably, with Vs alone, we are unable to distinguish between liquid water and gas within the pores.
Figure 1. Image of force chains in photoelastic granular media, showing that microrheology of granular systems are heterogenous at the mesoscale. [Author: Karen Daniels].